Cultural Dynamics
This is a computer program for visualising historical and cultural events, influences and interactions.The program originated from the author’s own need to visualise when people lived, who else was alive at the same time, how they were related, when they created their works, which people influenced each other and what other events occurred and influenced people or their works. The program creates a diagrammatic model of a timespan.
The following basic requirements for a diagram were identified as follows:
- Simplicity: as Einstein said, models should be as simple as possible but no simpler. We would like to have as few different symbols as possible so that diagrams can be easily read. The aim is to visualise information without extraneous decoration.
- Generality: it should be possible to represent any desired relationship or connection.
- Consistency: help the user to ensure internal consistency and completeness.
- Single Function: it should not implement functions that other programs do better but should be open to exchange data with other programs.
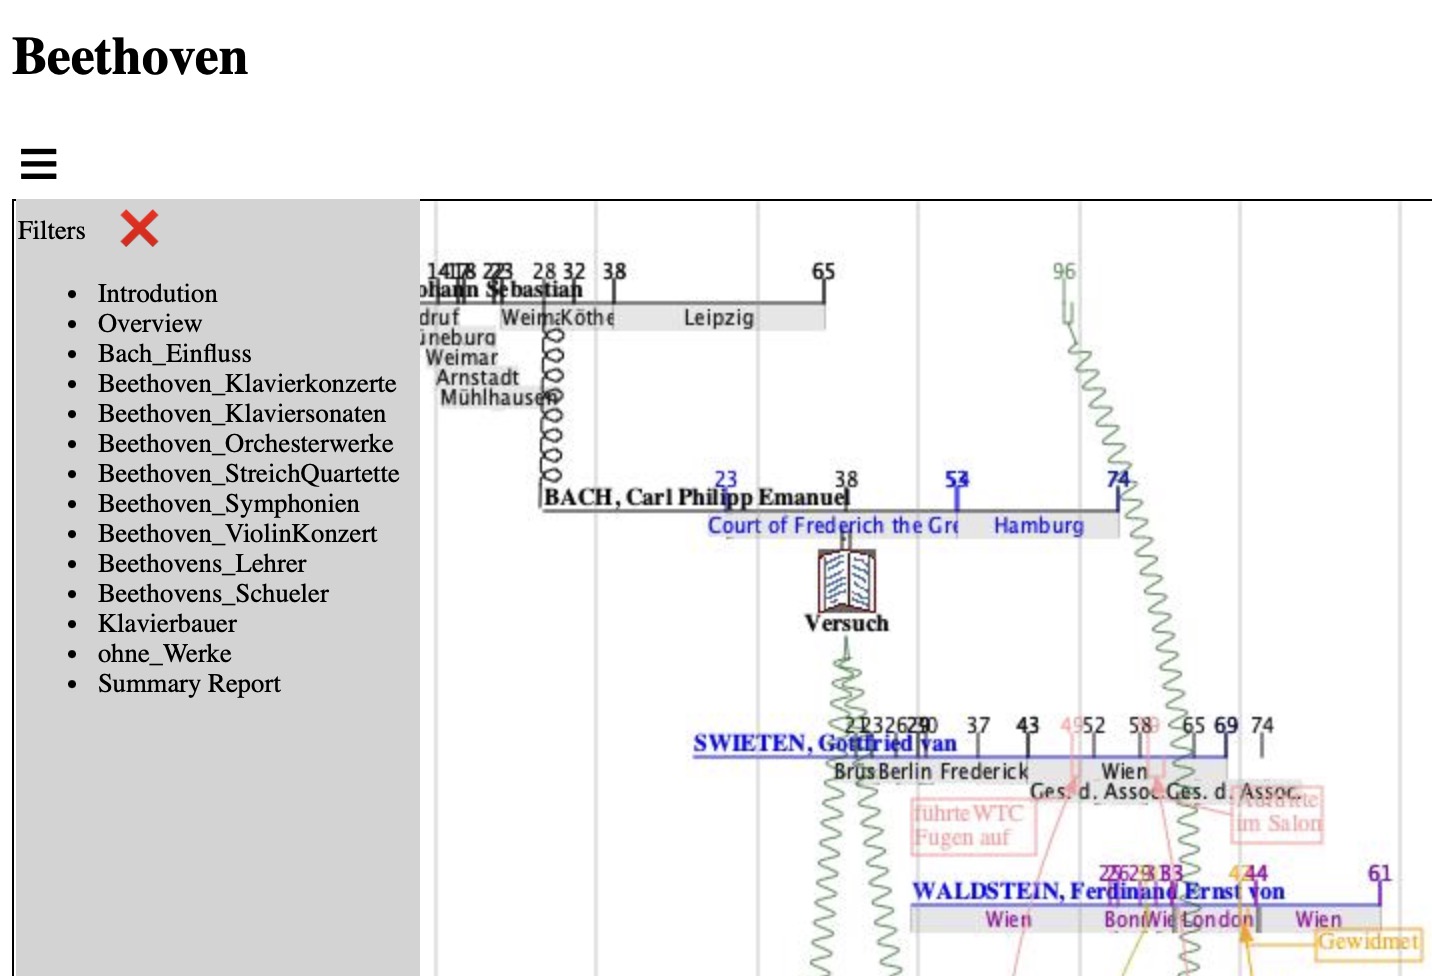
- Hash-tags from social media,
- Cross-reference and missing data reports from software development,
- Connection shapes from Feynman diagrams for Quantum Electrodynamics in particle physics (hence the name - the program was originally called "Quantum Cultural Dynamics"),
- Bézier curves from the car industry.
Completeness and consistency are supported by cross-reference and missing data reports.
Diagram objects have unformatted descriptions, but we do not wish to duplicate information available elsewhere, and do not wish to reproduce text processors, so each object has links to other sources. The data can be exported as HTML for use elsewhere.
Main Features
- Timelines, Events related to timelines, General Events, Untimed Events. Apart from the basic data, these can have links to external sources.
- Optional user-defined icons for events and start and end of timelines.
- Zoom and pan of timeline
- Division of timeline into segments.
- Optionally show age on timelines.
- Connections between the above: direct, wave, spiral; plain, dotted, dashed; straight or curved; arrow heads at ends.
- Connections labelled with moveable names.
- Vague Dates, e.g. 1500 rather than 1500-12-31; intelligent entry (just type the year).
- User-defined colour palette.
- Hash Tags and comprehensive Filters.
- Add multiple levels of linked items to the filter.
- Restrict view between dates.
- Find function, including regular expressions.
- Separate texts for overall introduction and technical notes.
- Reports to extract data, ensure consistency (cross-references), detect missing data. All in html for internal navigation and export to text processors or presentations.
- Import selected objects from other files.
- Export of graphics in any resolutions and paper size, e.g. for presentations or documents.
- Complete html export for viewing outside the app or on websites.
- Filter and Find in separate windows to drive presentations from a second monitor.
- Storage in JSON text files.
- JSON files had too many backslashes for escaped characters
- Connection descriptions were not being read from the input file.
- The Missing Data Report now includes a section for duplicate links.
- The Missing Data Report now includes a section for filters that have tags that are not used anywhere.
- The Import function can now merge the description and links for events and connections that already exist.
- The Find function can now export the results to an HTML window. This can be exported to a file or printed. It includes statistics on the number of places where the string was found.
- The Save As function now has a check box for Fitlered Extract. This will only save the events and connections in the filtered view.
- The event editor's "connections" tab has been changed to "Related" and now includes a list of a timeline's timeline-events.
The New Event button has been removed from the editor - the function is in the Related tab.
All the tables in the Related tab can now be sorted by clicking on the headers. - New menu item in View menu to close all editor windows.
*** NEW in v11.02 ***
Errors Corrected
Other Changes
Sample Files
This compressed ZIP file CD_Samples.zip contains some JSON files with sample data and an icons folder.Unpack the ZIP file and move the JSON files to a location of your choice.
Either put the icons folder in your home folder where it will be found by the program, or put it somewhere else, in which case you will have to set that location in the preferences after starting the program.
The icons are fairly basic and were made with the Pixen program.
The Renaissance file is very large, so only performs well when using the filters.
Much of the Description content in the Beethoven and Renaissance files was gathered by the Claude artificial intelligence program and has not all been checked. This content is prefixed with "[Claude:]".
These are all work in progress and not complete and not all correct.
Examples
The examples show exported graphics which can be used in documents or presentations, a view of the filter window and a link to a full HTML export of several timeline files.Printing Press
Beethoven's Pianos
Palazzo Quirinale
The Filter Window
Each filter stage has buttons to determine whether items that have all the selected tags, any of the selected tags or none of them will be shown.
The tags to use are selected from the list of available tags. To find a tag in a long list, the first few letters can be typed.
The filter stages are combined with Boolean operators AND and OR, so here we have any of the people in the first stage AND none of their books or paintings.
Filters can be saved with a name and description, and then selected from the list to use them.
The HTML export creates an image for each filter and a menu to select them.
HTML Export
The html export is a simplified view of all the filters defined in a data file. It gives a basic view of the data, with display of the metadata by clicking on timeline or event names in the graphic (this does not work reliably in all browsers).
The html export does not have the full functionality of the program.
Each has a menu icon at the top left where the views can be selected. The Overview is the complete database and can be overwhelming. Each filter shows a certain aspect of the total. There are also entries for the introductory text and the full summary report, which lists all the data in an html file.
The original files can be downloaded from the Sample Files section above and can then be used with the full functionality of the downloaded program.
See also the note on AI content under the heading Sample Files above.